
2020 Global Math Art Contest
Desmos's first Global Math Art Contest in 2020 featured over 4,000 graphs from over 100 countries around the world. Here are the winners and finalists, chosen from countless examples of incredible effort, artistry, ingenuity, and creativity.
1st Place
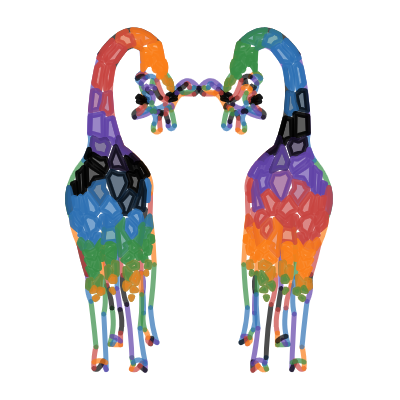
Kari Yatsushiro
Oregon, USA
From the judges: This graph is a stunning intersection of art and mathematics. The judges were struck by the vivid coloring, originality, and personality that Kari was able to capture with just our 6-color palette.
“Even though what initially captures your eye are all the brightly colored and strangely satisfying polygons making up the spots, the whimsy and expressions of the giraffes themselves come across in just a handful of key functions.”
From the artist:
“Through this process, I learned how mathematics can be turned into a work of art. This graph was created with a lot of trial, error, and tons of patience. In the end, I created something that I am proud of and had fun learning in the process.”
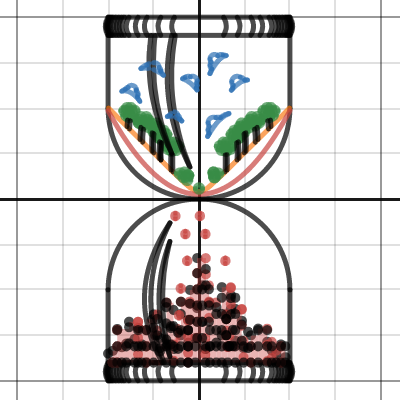
2nd Place
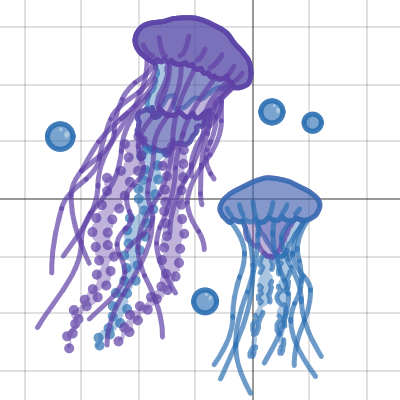
Valerie S.
California, USA
From the judges: Multiple judges noted how lovely the colors and textures are, with so much richness captured by just two colors. The bubbles are particularly breathtaking, with their subtle animation and reflective glints. Notice how the tentacles are created with pieces of many different arcsin functions, which is no small feat!
From the artist:
“For my graph, I wanted to play with the graphing calculator's limited color palette, and I was able to create several different shades by layering with just two colors. I used bubbles and sliders to create an illusion of motion in the water.”
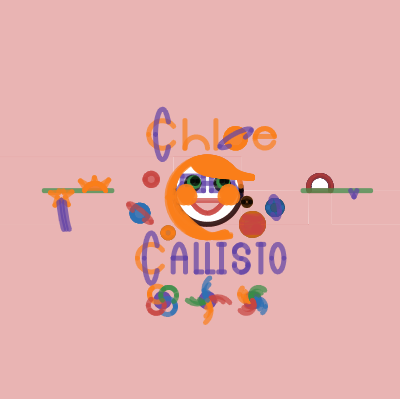
3rd Place
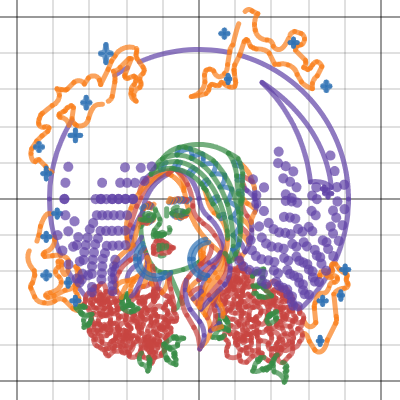
Chloe Lum
Kuala Lumpur, Malaysia
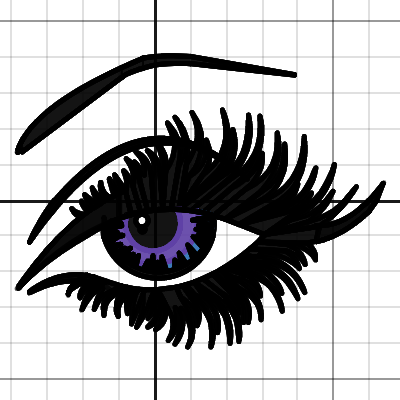
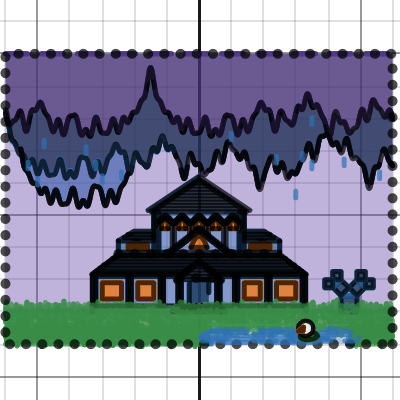
From the judges: Chloe's hand drawing on which this graph is based would have been impressive enough. She then brings it to life with a wide variety of equations and line styles. Subtle, animated hyperbolas seal the deal as one of the most original and beautiful graphs we encountered.
From the artist:
“I was reading several fantasy books at that time, and that's when I got the idea to present something magical and enchanting. Incorporating my mathematical knowledge and Desmos' tools was quite difficult, but I learnt a lot of new tricks and equations along the way. It was really fun and exciting.”
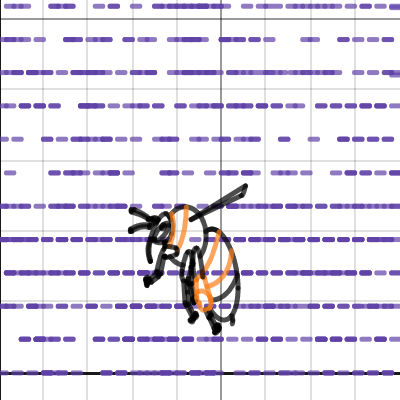
Best Audiotrace: Nathan Lee
Pennsylvania, USA
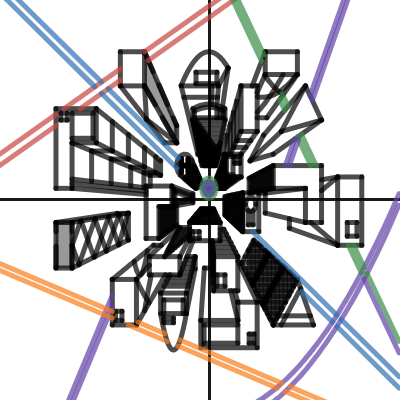
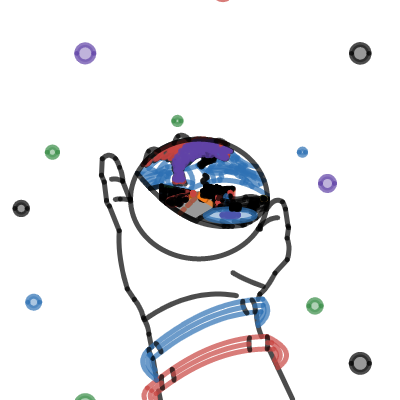
From the judges: The judges decided to make a special category for this incredible graph. Nathan uses the Desmos audio-trace feature, originally designed for vision-impaired and blind students, to create a masterpiece based on Rimsky-Korsakov's "Flight of the Bumblebee." It's a multi-sensory mathematical experience—buckle up!
From the artist:
“My inspiration for choosing this topic was to show how math can be turned into a wonderful animation and a great song, so I decided to choose the Flight of the Bumblebee song along with an animation of a bee flying. Using The Flight of the Bumblebee song I can show that even a song which is fast and has so many notes, can still be made using the power of math. Also, I wanted to challenge my math and music skills, so I put a lot of effort figuring out how to put the song together, making sure each note was as close to tune as possible, and I made sure the animation looked well with the song.”
Finalists 2021
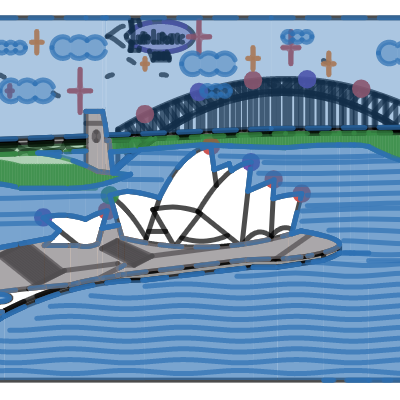
Luke Lipovic
Sydney, Australia

Austin Anderson
Minnesota, USA
Gaia Munno
Lazio, Italy
Jerry Yang
Indiana, USA
Heber Faucheux
Wisconsin, USA
Isha Jannu
Texas, USA
Kokono Hirowaki
Kanagawa, Japan
Davide Bracci
Lazio, Italy
Maggie Barnes
Pennsylvania, USA
Samuel Ayokunle Obigbesan
Kent, UK
Anna Stevens
Missouri, USA
Ethan Lam
Kuala Lumpur, Malaysia
Jason Chen
California, USA
Student
California, USA
Ray Egner
Illinois, USA
Student
Washington, USA
1st Place
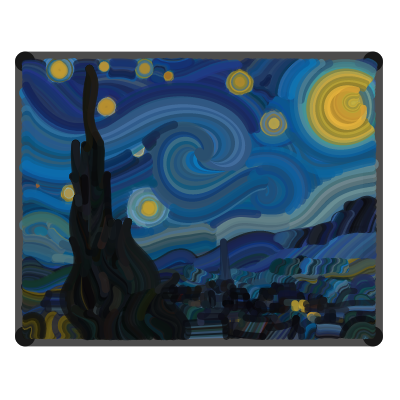
Alexander Manville Muench
Brighton, UK
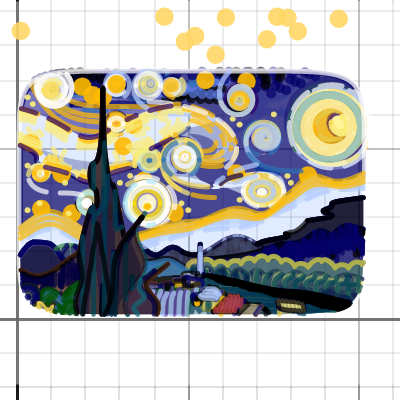
From the judges: Every judge was awestruck by this graph. Warning: this graph may take a while to load.
“There's something I find wonderfully creative about using Bézier curves to so vividly recreate the effect of paint brush strokes. These curves are ubiquitous in computer graphics, so much so that you might not think there's room for a novel use, and yet you never quite see them function like this. The overall effect is visually quite striking.”
“Artists and art critics have pondered The Starry Night for well over a century, and with good reason—its depiction of mathematical turbulence in the sky is entrancing. This artwork's clever use of colour and Bézier curves is stunning.”
From the artist:
“I’ve been actively invested in the Desmos community for the past 8 months, and to create something like this has been a lasting ambition. My interest in Bézier curves was piqued while making a graph of their construction for my Maths teacher. With little experience in art, my choice of painting was influenced by a Dr. Who episode on Van Gogh.”
2nd Place
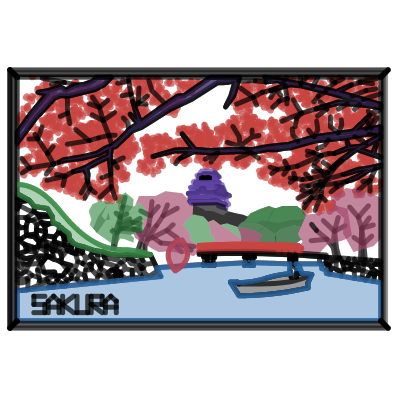
和田 昂志郎 Koshiro Wada
Japan
From the judges: The judges all noted the extraordinary detail and artistry in this graph. It’s even animated. Warning: this graph may take a while to load.
“The human mind is famously poor at creating randomness, and yet in the fantastic arrangement of sakura flowers in this artwork I can see a wonderful balance between chaos and structure. I also love the care that was taken in creating the branches so that they mimic the fractal geometry of real trees—a very nice touch!”
From the artist:
“I was inspired by Japanese beautiful view because I’m Japanese. I learned how to draw the graph with symmetry by using absolute value and how to rotate the graph around moving point.”
3rd Place
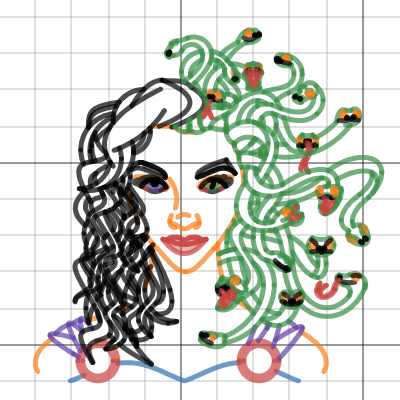
Grace Kanaley
California, USA
From the judges: The judges agreed that this graph is...
“An ingenious use of ellipse arcs and trigonometric functions to create the wavy hair and snake bodies. The technical brilliance is so seamless that it allows us to be taken in by the emotion on the character's face and even on the snakes themselves (some of them have real attitude)!”
“Beautiful, with amazing detail in the heads of the snakes.”
From the artist:
“This art contest provided a beautiful way for me to marry my passion and interest in both Greek mythology and in mathematics. Because of the ambitious vision I had in mind, I pushed myself to learn equations that I have not yet been taught. I was able to render my vision with ease, thanks to the intricate software and my newfound knowledge.”
Finalists 2021
Jason Mo
California, USA
Benjamin Lacasse
Québec, Canada

張庭禎 Ting-Chen Chang
Taipei, ROC (Taiwan)

Helena Reis
Rio de Janeiro, Brazil

YY
Yokohama, Japan
Olivier Meiler
Maasdriel, The Netherlands

Markson Chen
British Columbia, Canada
Sean Kawano
Washington, USA
John B.
Virginia, USA
Zoltán Kalocsai
Szombathely, Hungary
William Sun
Sydney, Australia
Ashley Jacobi
Melbourne, Australia / The Netherlands

Chaarvi Sood
Workingham, UK
Owen
United States

Forrest Fankhauser
California, USA

Adrianna Phan
California, USA
Arantzazu Nogueira Gil
Valle de Mena, Spain
1st Place
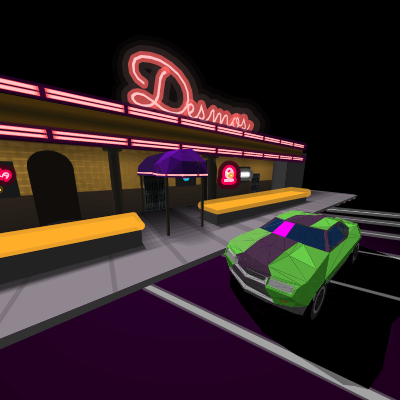
Ezra Oppenheimer
Ontario, Canada
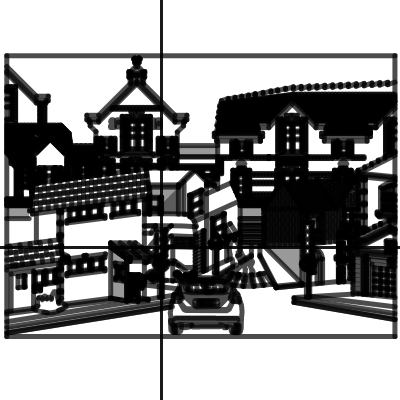
From the judges: This graph is, simply put, the most incredible work of mathematics we’ve seen in our calculator’s history. The math goes incredibly deep, from the vertex data buffers behind the rendering of the car to the use of stacked parametric ellipses to control lighting and shadows. The result: a stunning, animated, navigable 3-dimensional world rendered in exquisite detail. Despite being over 3,000 equations long, this graph runs far more smoothly than we expected, a sign of Ezra’s focus on performance and optimization. A true mathematical and artistic tour-de-force. Warning: this graph may take a while to load.
From the artist:
“I scouted GTA 5 for inspiration and found a background that looked very plausible! Next I developed a 3D system from scratch; this allowed me to communicate between Desmos and Blender 3D interchangeably. Finally, I learned how to manipulate math to create shadows, reflections, and occlusions, just like the real world!”
2nd Place
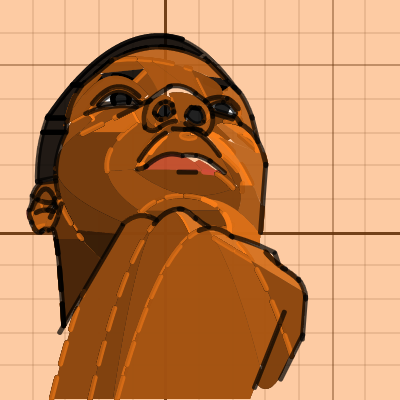
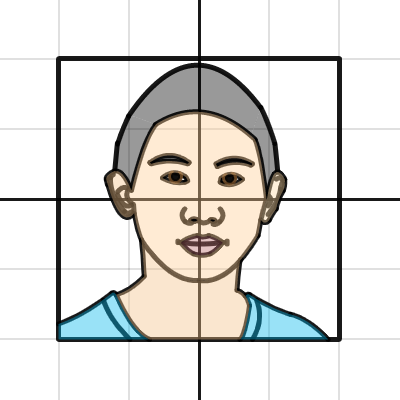
Jared Georgeon Etienne
Massachusetts, USA
From the judges: The judges were all blown away by the pure artistry of this graph. Warning: it may take a while to load.
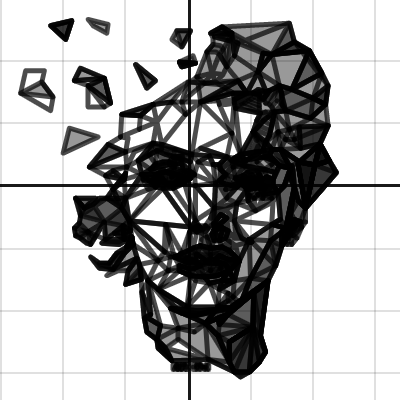
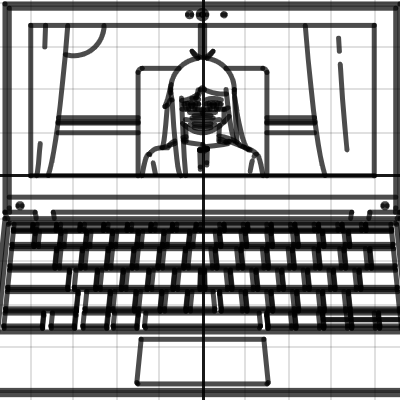
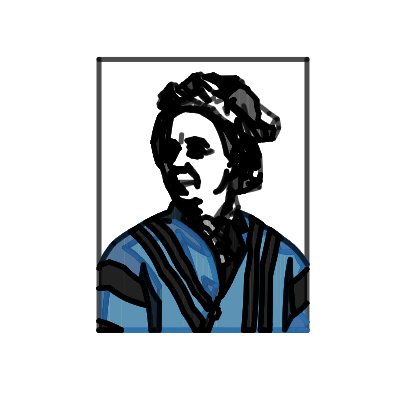
“It takes real courage to tackle the complexities and nuances of a human face with nothing but circles and parabolas. This self-portrait even makes things harder by adopting an extreme perspective that removes some of the natural symmetries which would have made this task simpler—and pulls it off with style.”
“There are so many little polygonal markings which, up close, look like imperfections, as one might expect when painting a face using mathematical function. But the genius of this portrait is that all those markings are what makes it look so human and real as you zoom out, somehow perfectly conspiring to give the image life-like shading.”
From the artist:
“I wanted to see the limits of making art on desmos when creating a realistic portrait. While I believe that I might have reached that limit after a few days of work, I still encourage others to test the capabilities of this interesting medium.”
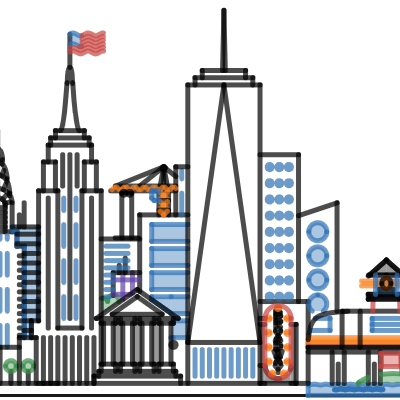
3rd Place
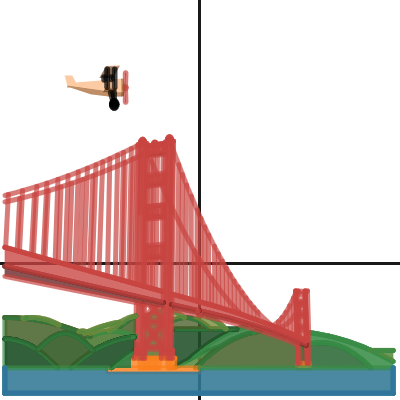
Ava Sutter
New Jersey, USA
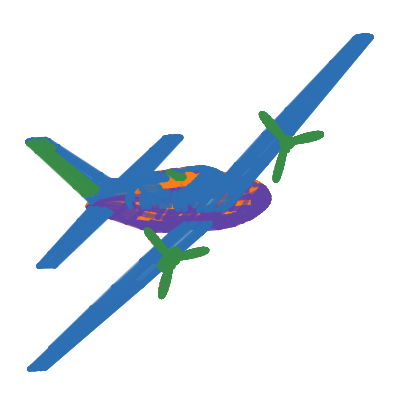
From the judges: This graph is a masterclass in the difficulty of simplicity. At first blush, it’s just a gorgeous graph of the Golden Gate Bridge. But then zoom in on one of the towers and observe how Ava stacks the colors to give a lifelike 3-D perspective. Look at the details, color stacking, and occlusion of the parabolic mountains in the background. We also loved the animation driving the airplane.
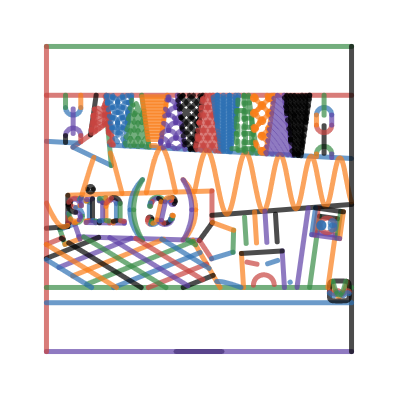
“In mathematics, we prize simplicity in our proofs, and this piece takes that principle and embodies it artistically. While the choice of functions is relatively understated, the overall effect is striking and the decision to mirror a classic view of an iconic object is very clever.”
From the artist:
“Before the project, I was looking through some old photo albums, and I came across a picture I took of the Golden Gate Bridge when I was on a trip in the 6th grade. I liked how the hills in the background resembled a sin graph, so I decided to recreate the whole picture on Desmos! From this process I learned how to use inequalities to shade a graph and how to restrict range and domain to make complex shapes. I also learned how to use graphs to animate a plane!”
Finalists 2021
Renee Garnett
Auckland, New Zealand

Andrew Pyler
California, USA
Mariana Melo
Mexico
Roark Chao
California, USA

Fumairia Laureijs
Nova Scotia, Canada
Caitlin "Katie" Minutillo
New Jersey, USA
Part Toon
Nebraska, USA

Cho Sui Ching (Stephanie)
Hong Kong, China
Andrew Kerr
Canberra, Australia

Rina
Virginia, USA
Jamie Kim
Surrey, Canada
Zeina Ragheb
Cairo, Egypt

Thomas Yam
Hong Kong, China
Julia Levy
Michigan, USA

Leon
Marlow, UK
Jonathan Gross
Florida, USA
Judy
Kuala Lumpur, Malaysia