
2021 Global Math Art Contest
More than 10,000 students from around the world participated in the second annual Global Math Art Contest! Here are the winners and finalists, chosen from countless examples of incredible effort, artistry, ingenuity, and creativity.
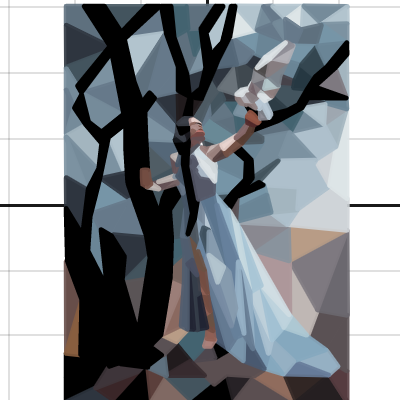
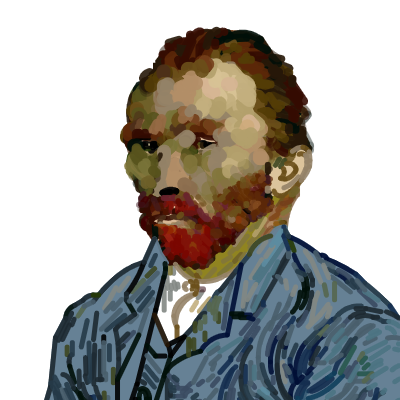
1st Place

“Serenity” by Yanzi Feng
California, USA
From the judges:
This is an absolutely stunning piece, made with clear attention to detail. Places where one function meet another are so smooth even when we look very closely. Not only is it beautiful, but it uses a wide variety of functions, from circles to Tschirnhausen cubics. The well-chosen colors and graphing techniques are all suited perfectly towards bringing this character to life.
From the artist:
Graphing is my favourite part of math, and I was really excited when Desmos decided to host a contest for it! The concept that equations - composed of mere symbols and numbers - can create all sorts of lines when graphed really fascinates me. I think it's sort of like mixing two chemicals together - you can sort of predict the result, but sometimes the only way to know for sure is to graph it!
2nd Place

“Modulo City” by Hamdoul E.
United States
From the judges:
This graph makes outstanding use of calculator features to incorporate lighting and depth, as well as random generation to build such a charming city. There are so many delightful layers to this scene! The designer’s use of parallax scrolling creates a three-dimensional effect that makes the experience feel immersive. We love the blend of design, math, effects, and even music that went into creating this amazing graph.
From the artist:
I was so interested by the thought that went into the construction of cities that I decided to visually recreate one myself. I always wanted to make a cityscape, and throughout the creation I learned more complex applications of the random function in my work and better usage of lists.
3rd Place
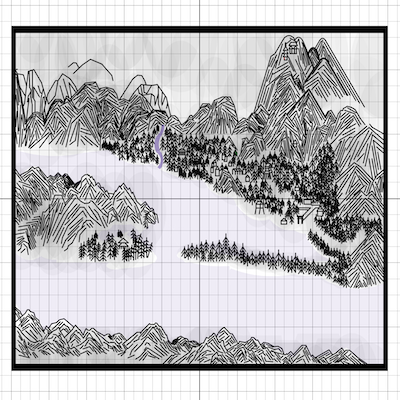
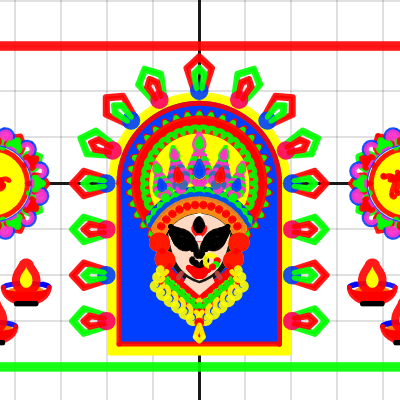
“Amanohashidatezu” by Sakuto Tsutsumitani
Sakuto, Japan
From the judges:
Amanohashidatezu is such a wonderful interpretation of its source material. When looking at the art very closely, it may appear that the artist simply created a chaos of lines on the calculator canvas, but an entirely different image is revealed when you take a step back. The bold strokes of lines start to take the shape of trees, mountains, and whole islands. Through the artist’s meticulous use of thousands of lines and beautiful but subtle elliptical shading, they’ve created a wonderful, bold piece with its own personality.
From the artist:
I chose ‘Amanohashidatezu’ because I felt it has a unique atmosphere. I wanted to make the graph similar to this painting so I used a lot of achromatic colors.
I learned the power of continuing without giving up. It was a lot of fun throughout the project.
3rd Place
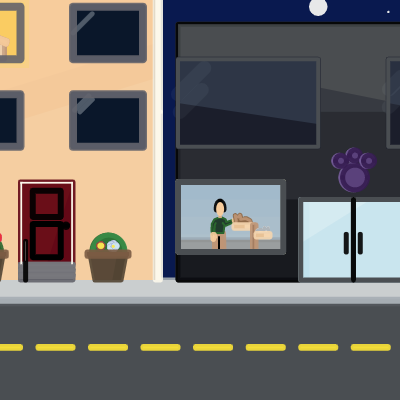
“Vibrant Cityscape” by Anna
Oregon, USA
From the judges:
Every time we open up Vibrant Cityscape, we enjoy scrolling through and seeing the wonderful details and surprises this graphed city has to offer. The well-chosen colors and lines that imitate light reflecting off glass or emitted from candles in a dark room are just two of the details that demonstrate the artist’s thoughtfulness and attention to detail when creating this piece. We love how the artist used the math tools available to them to create a town that feels so alive, and it leaves us wanting to know more about the stories of its inhabitants.
From the artist:
For this project I created a cityscape filled with vibrance and beauty. I wanted to design a scene that pulled the viewer in and showed them bits and pieces of a world full of individual stories. Throughout this experience, I have pushed myself to work through the challenges that arose and to learn new things in order to breath life into my artwork.
Finalists 2021
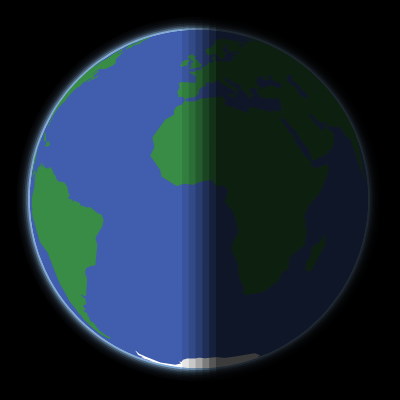
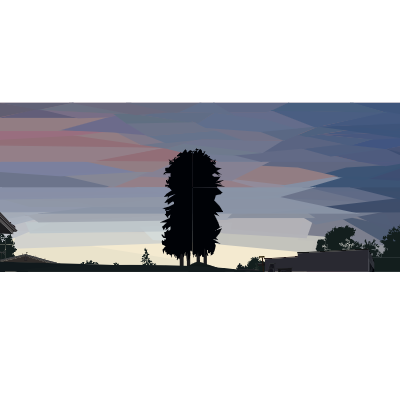
“The Blue Marble” by Joshua Wang
Wisconsin, USA

“Ballerina” by Nisma Khan
United States
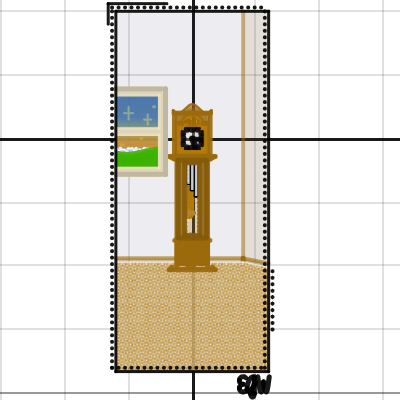
“Grandfather Clock” by Esther Walker
Kansas, USA

“Rising Phoenix” by Daniel W.
Hong Kong, China
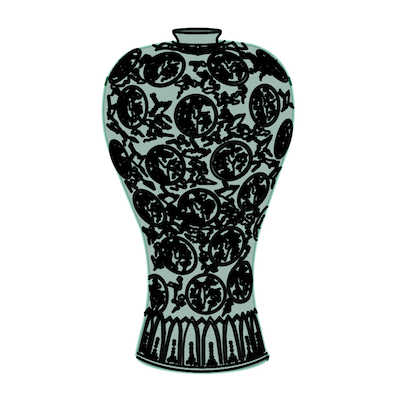
“Goryeo's prunus vases” by JinSoo Kim
South Korea
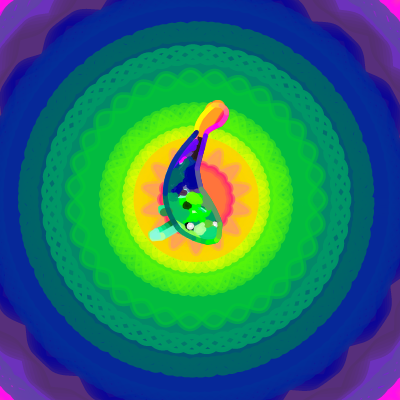
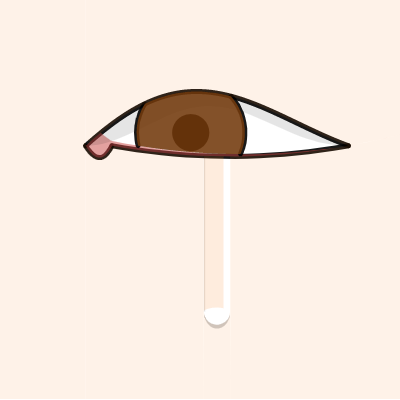
“Fish” by Arishka Jha
California, USA

“Weightless” by Gabriel Muldoon
Virginia, USA
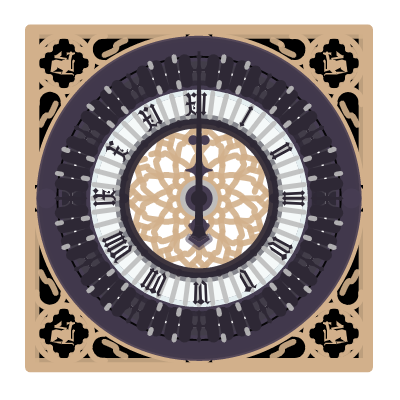
“Big Ben Clock Face” by Avi Darbari
United Kingdom
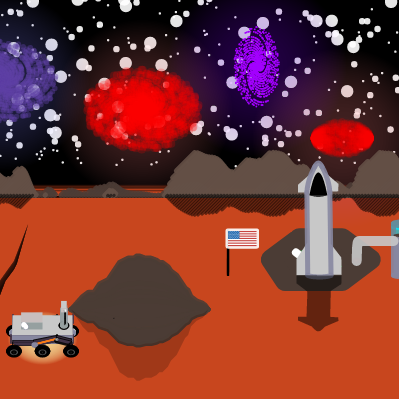
“THE RED PLANET” by Jake Kirby
North Carolina, USA
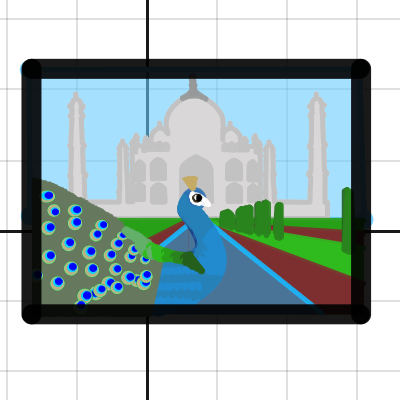
“Peacock” by Trish Chettypally
California, USA

“Turtle” by Ryan Bartlett
North Carolina, USA
“A Spaceship in Two Worlds” by Gyula Marka
New York, USA

“Covid-19 Brief Safety Guide” by Henry Liem
United States

“Moonlit Forest” by Leah Mehringer
Colorado, USA

“A Street in Manhattan” by Timur Tirkashov
Denmark
“Ducks” by Rena Civan
Pennsylvania, USA
1st Place

“Nine Lives in Perspective” by Valerie Shu
California, USA
From the judges:
At first glance, this appears to be a static graph, but look a little deeper and you’ll notice the wagging of the cats’ tails, the ticking of the clock, and the oscillations of the screensaver. The most striking thing is that each cat is unique not just in its apparent coat and color, but in its mathematical nature: each is outlined by a different class of functions, including linear, parabolic, cubic, exponential, logarithmic, sine, arcsine, elliptic, and Bezier curves. A mathematical and creative tour de force.
From the artist:
I was inspired to make this graph by the idea that cats have nine lives, with every cat in this scene being made entirely of a different kind of equation. I also made the vanishing point of the room (0,0) so I could also play with perspectives. This project was especially challenging for me as I had to master a variety of equations and learn the basics of perspective all in under a week.
2nd Place
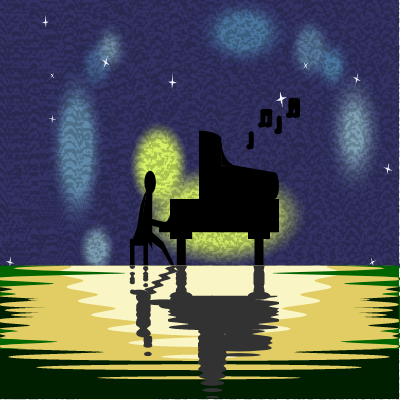
“Moonlight Sonata” by Nathan Zhao
Washington, USA
From the judges:
Perhaps you first noticed the shadowy representation of a person sitting at a piano. Or maybe the subtle animation of the notes coming out of the piano. Maybe it was the rich background texture from a complicated implicit expression, or the wavy morphed ellipses that form the reflection in the water. Or maybe it was the audio trace on line 2 that plays the entirety of Beethoven’s “Moonlight Sonata.” Wherever you look, you’ll find layers upon layers of interesting and beautiful mathematics.
From the artist:
I recreated one of my paintings of a moon and a person playing the piano and turned it into a multisensory experience using the Desmos Graphing Calculator. I explored and learned how to create animations and use the audiotrace feature to create music.
3rd Place
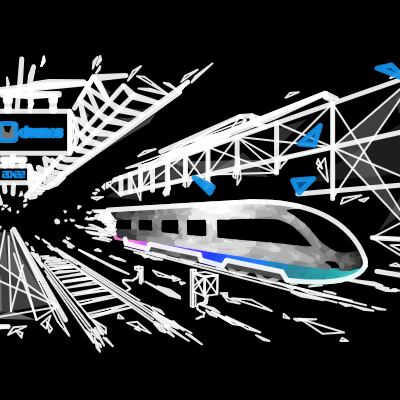
“Untitled” by Colin Lam
Malaysia
From the judges:
The judges were struck by the impeccable use of color, line thickness, delicate shading, and the appearance of motion. Dynamic colors are used sparingly but effectively, highlighting the digital station sign and the few shards of glass. Overall, a visually stunning piece that combines many different features of the calculator into a truly original creation.
From the artist:
I've always had an innate passion in trains during my childhood. Throughout this journey, I have learnt a myriad of techniques including colour-changing objects and Bézier curves, which I then integrated into this piece with the focus of a vanishing point.
Trailblazer
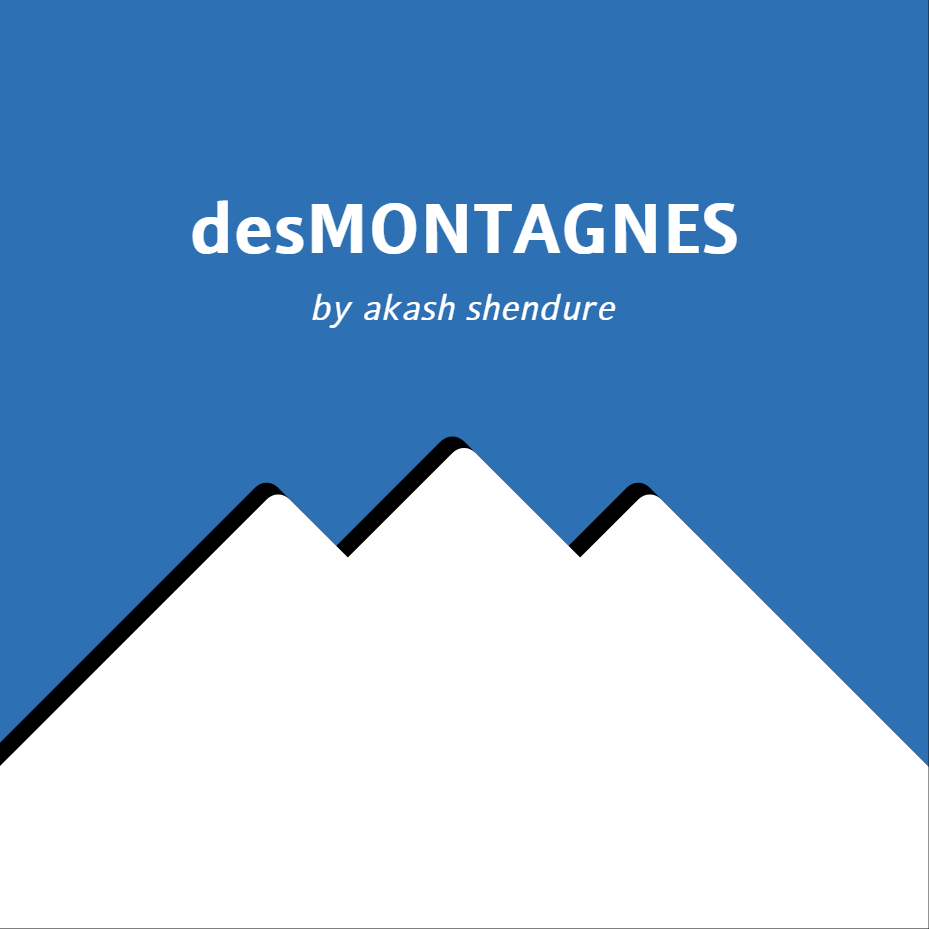
“desMONTAGNES” by Akash Shendure
Washington, USA
From the judges:
This graph blew us away with its blazing-fast performance, incredibly concise expression list, and charming graphics. At Desmos, we all love a well-organized graph with clearly named variables and well-organized folders. The judges also admit to spending a little too much time playing this delightful game.
From the artist:
I made this graph to commemorate my love of skiing, which I haven't been able to satisfy while living abroad in Djibouti and Taipei during the past few years. I wanted to create a simple, fun, and challenging skiing game in Desmos using what I've learned while interacting with the Desmos community over the past year, and I used the default Desmos colors to make the game "feel" like Desmos. The greatest challenge was trying to make the game appear the same on all devices, creating the need for device calibration.
Finalists 2021
“Starry Eclipse” by Olivia Zheng
New York, USA
“Sunrise” by Saoirse O'Hair
Virginia, USA
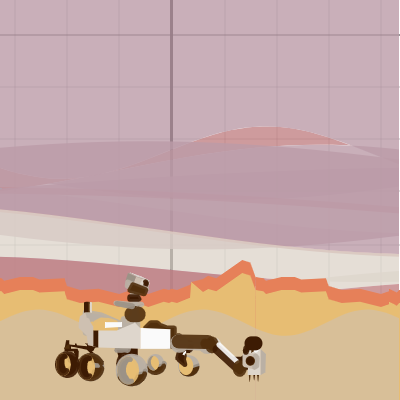
“Perseverence Rover” by Lily Levitsky
New York, USA
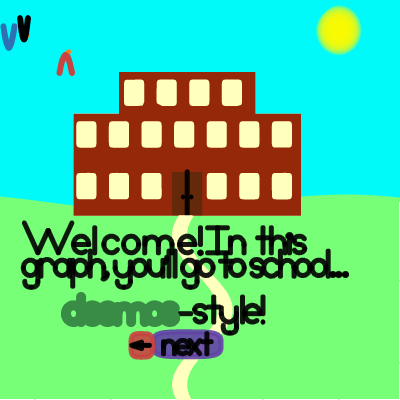
“School Tour” by Anna Grigorescu
Illinois, USA
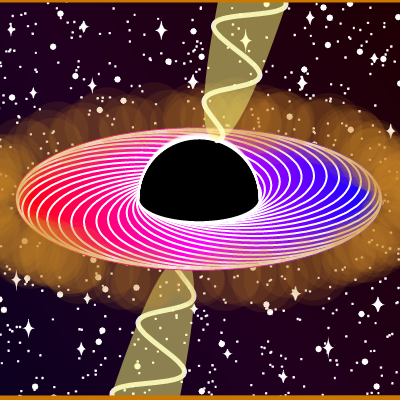
“Blackhole” by Nathan Agius
Missouri, USA
“Birds of Paradise” by William
California, USA

“Self Portrait 2” by Anonymous
California, USA
“Forest” by Jana Khaled
Turkey
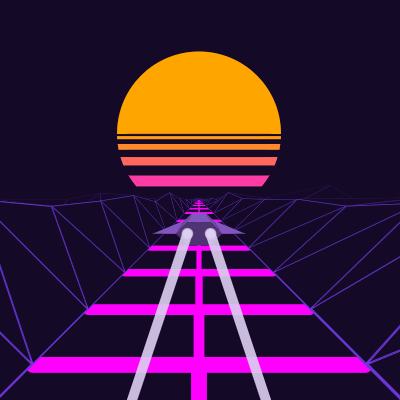
“VapourWave Final” by Ollie Barton-Hills
New Zealand
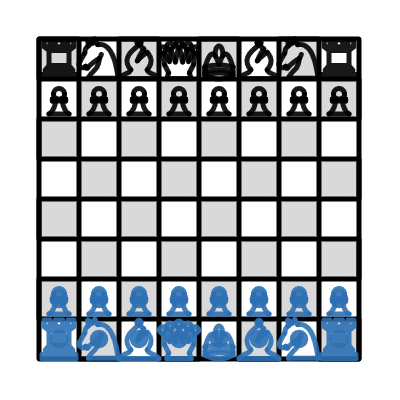
“Chess” by Jonas
Texas, USA
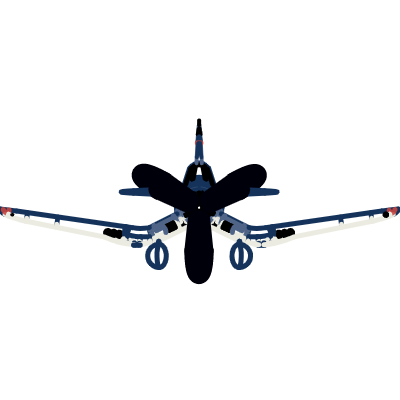
“Vought F4U Corsair” by Yuhong S.
Pennsylvania, USA

“Shading with circles” by Rohanna Hasselkus
United States

“SPACE” by 李天宇Tian-Yu-Li
China
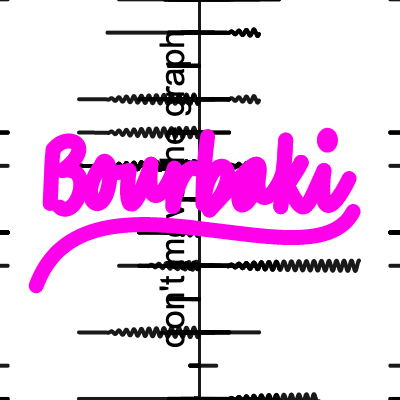
“Bourbaki” by Ranny Bergamotte
Georgia, USA
“Art Submission” by Minh Khue Truong
California, USA

“A Window Through Time and Space” by Olivia Friedrichs
California, USA
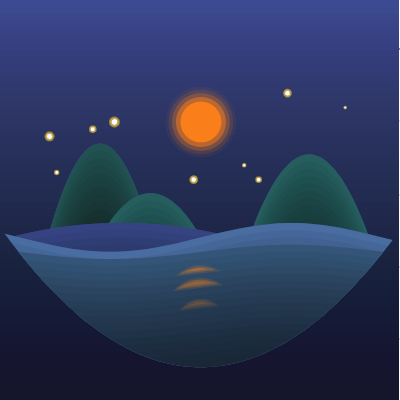
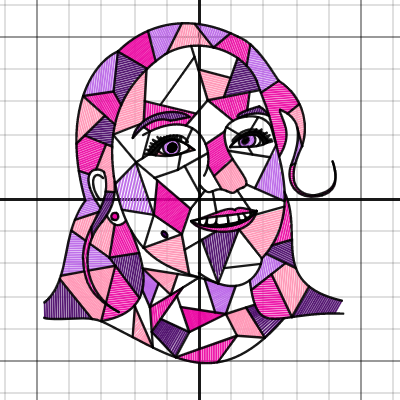
1st Place
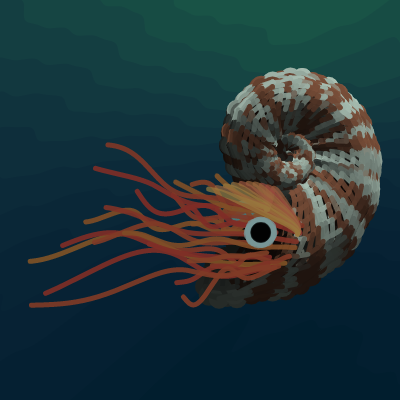
“Ammonite” by Harry Chen
Canada
From the judges:
Ammonite is a seamless blend of sophisticated mathematics and nuanced artistic expression. Each component contributes to its wildly immersive environment. The creature is brought to life by the natural-looking striping on the shell with random mottling and uneven spacing, the organically rippled gradient of the background seascape, the undulating tentacles in the ocean depths. We also love the web of segments and points that cleverly and thematically mimics the look of a net.
From the artist:
My artwork is a creature with a spiral shell and tentacles moving underwater. I have been fascinated by objects from the sea, especially the spiral shells of mollusks, so I choose to create an ammonite whose shell can be easily modeled using parametric equations. I use this opportunity to explore the limit of the calculator to create a three-dimensional object that displays realism, while I intended that viewers can easily recognize the mathematical primitives.
2nd Place
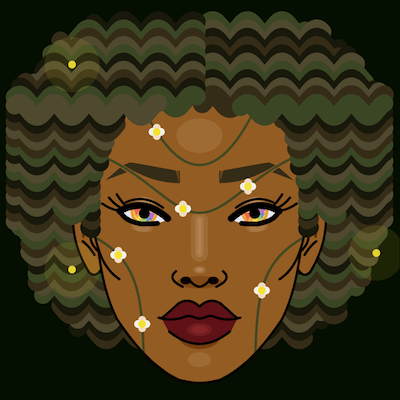
“Earth Woman” by Maya Thompson-Leonardelli
Canada
From the judges:
Earth Woman uses a variety of expression types to create a spellbinding artistic masterpiece. She is the forest manifest. Her sinusoidal hair billows with the colors of lush foliage, and her face is adorned with vines and blossoms. We were charmed by the subtle glow and hovering motion of points flying around like little fireflies. Don’t miss the rainbows in her irises. The layering of line opacity and thickness is a lightweight and effective solution to create the illusion of light reflecting off the skin. This piece captures the power and beauty of nature in a portrait of a woman.
From the artist:
My project was inspired by different illustrations and depictions of “Mother Nature/Earth”. I took the desmos art contest as an opportunity to create my vision of this mythical personification of our planet. While doing so I also learned more about animating on Desmos, and how to best use the different parent functions to create detailed line art.
3rd Place
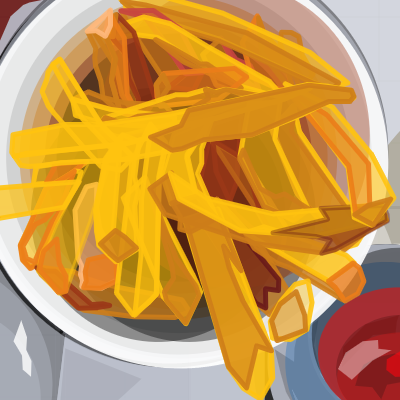
“Euphoria” by Sheila Wang
China
From the judges:
We love it when we discover that an exceptional piece of graph art in our finalists began as another, equally impressive, but stylistically different piece of art. Deviating from the realism of her original pencil drawing, Sheila completely embraced this new canvas to create a fresh and striking new oeuvre. The thoughtful layering of irregular polygons and opacities construct an abstract but legible composition full of depth and volume. The subtle movement in the shimmer on the ketchup and the changing colors of the background bring a whimsy to this piece that would have been lost in other mediums.
From the artist:
What will realistic art look like when expressed abstractly? With this thought I drew one of my realistic food art "Euphoria" again using desmos. Focusing on the structure of the fries and the overall appearance rather than the texture and the details, the new art echos but differs from the original.
Trailblazer
“Desmos in Desmos” by Jared Hughes
California, USA
From the judges:
The Desmos-in-Desmos calculator is out of this world. It is a true feat of design that uses all tools available to make this both performant and expansive in what it can do. Enjoy graphing your own expressions, or try clicking on the die to get a random pre-loaded graph. We had great fun testing the limits of what this very meta-calculator can do, and encourage you to as well.
From the artist:
I drew inspiration for this project from one of my favorite works of art: the Desmos Graphing Calculator itself. This graph is the culmination of months of tough design designs, trade-offs, and hard work. Throughout the process, I learned about architecting, building, and iterating such a huge project with a focus on performance.
Finalists 2021
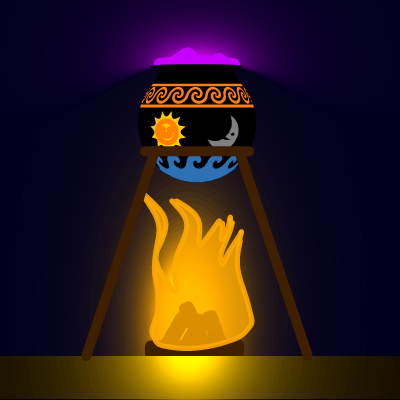
“Magic Cauldron” by Zoltán Kalocsai
Hungary
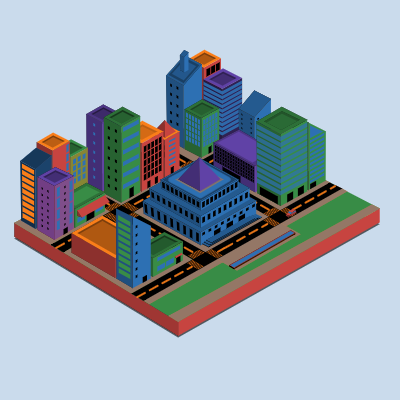
“Final City” by Mrigank Pawagi
India
“Happy Festive” by Ankit Kundu
India
“Cubiverse” by Jake Walker
North Carolina, USA
“Time” by Tyler Longo
New Jersey, USA
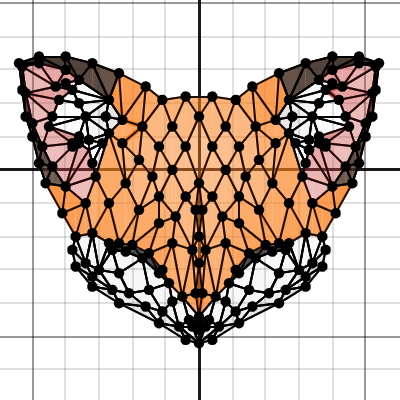
“Fox” by Chloe Hombrebueno
Canada
“Math Contest” by Kailah Kilfoyle
Canada
“Raycasting Engine” by Jack Freeth
New Zealand
“Whirling Ribbons” by Markson Chen
Canada

“Underground” by Mia Rebecca Bianchi
Italy
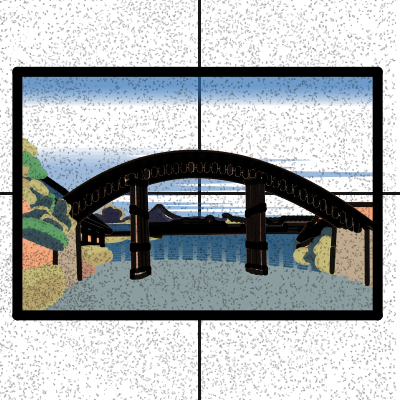
“Under Mannen Bridge at Fukagawa” by Sean Kawano
United States
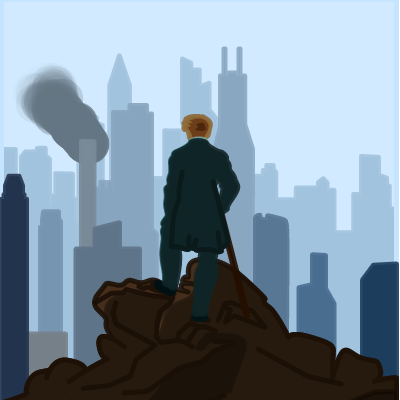
“Wanderer above the sea of smog” by Niccolò Geraci
Italy
“Unveil” by John B
United States
“Almost Home” by Jonathan Jarchow
Colorado, USA
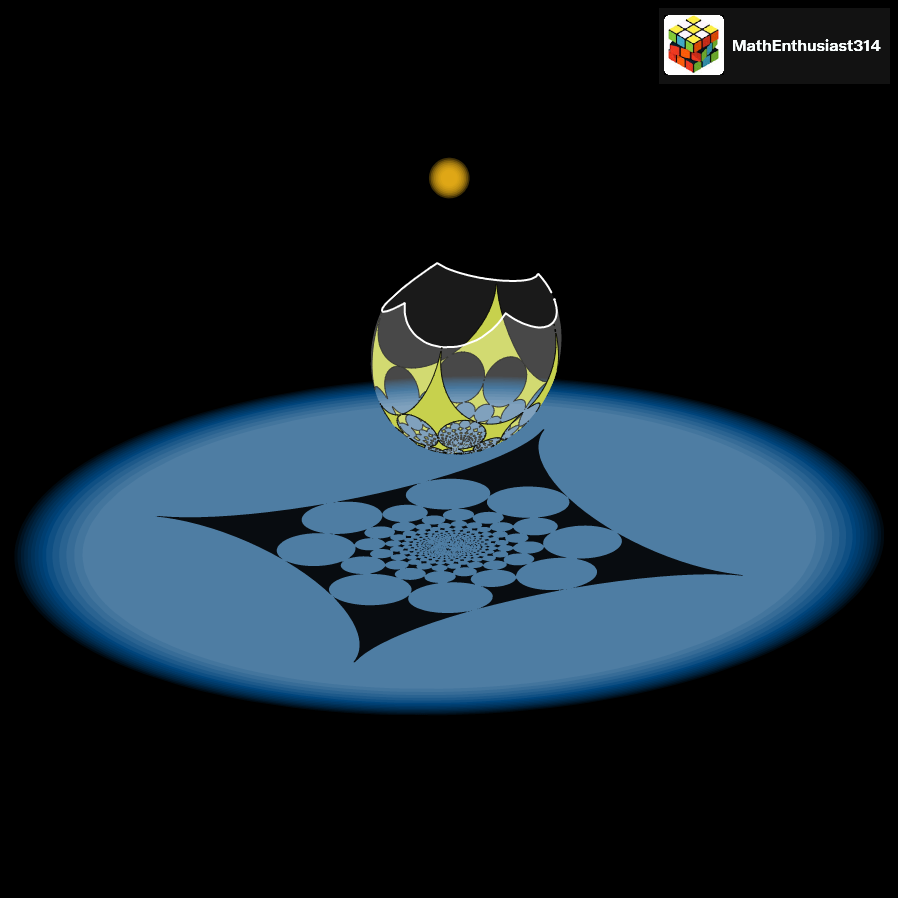
“Spherical circles casting circular shadows” by MathEnthusiast314
United States

“Space” by John Payne
New Jersey, USA
1st Place
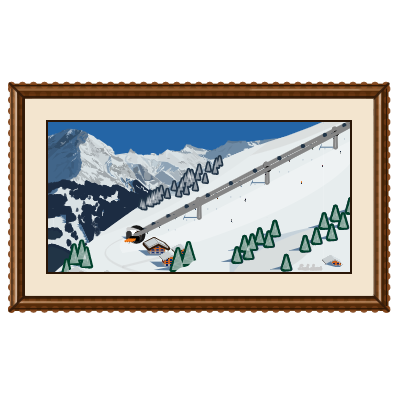
“Swiss Ski Slopes” by Leah Simon
Ohio, USA
From the judges:
This graph takes advantage of nearly all the ways Desmos can be used to create shapes. There are polygons building up the shadows on the mountain, inequalities filling in a gradient of snow on the slopes, and a hue of blue for the ski lift windows. The trees come from vertical sinusoids, while the frame around the entire scene is decorated with explicit equations of lines. Parametric paths provide a way down the mountain for each individual skier, themselves simple images created in an earlier graph. As beautiful as the view is from afar, zooming in reveals new details and delights—who knew a skiing cow could face such peril? Hit play, sit back, and enjoy the cycle; then zoom in and watch it all again!
From the artist:
Creating this animation took me back to the days I spent volunteering in Switzerland; I tried to stay true to that through the mountain background based on a photo I took, the snow piled high on the roofs of chalets, and the animation. I applied periodic and parametric functions to create hundreds of trees, and to animate the chairlift and skiers so it is seamless, even when the slider loops back to the beginning. To animate the pieces seamlessly, I created the images of the skiers and chairs using lines and polygons, exported them as images to animate them both individually and using lists, which helped me to create the working chairlift and the skiers on the slope.
2nd Place

“Blooming Flower” by Ye Shun Hew
Malaysia
From the judges:
Blooming Flower planted a seed in our hearts that grew with each passing scene. Outside of Desmos, the story told here would be an engaging narrative. Within the confines of a graphing calculator, it becomes an impressive display of planning and positioning. The artist even found a wonderful technique for saving calculator resources by disabling unnecessary expressions, a key technique that allows the full story to be appreciated! Set aside some time to watch through this engaging tale.
From the artist:
I always want to tell a story by animation in Desmos, and see if it can render in normal speed (24 fps), therefore I gave it a try. I learned various ways to optimize the performance, some usages of list and action, animation technique, developed much deeper understanding about Bezier curve and so much more.
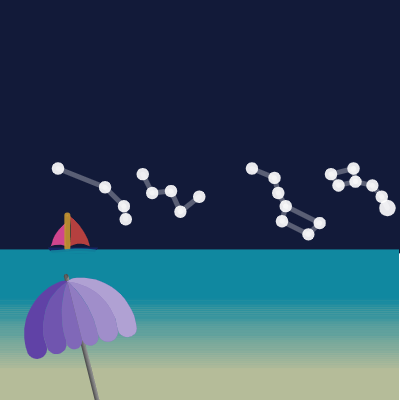
3rd Place
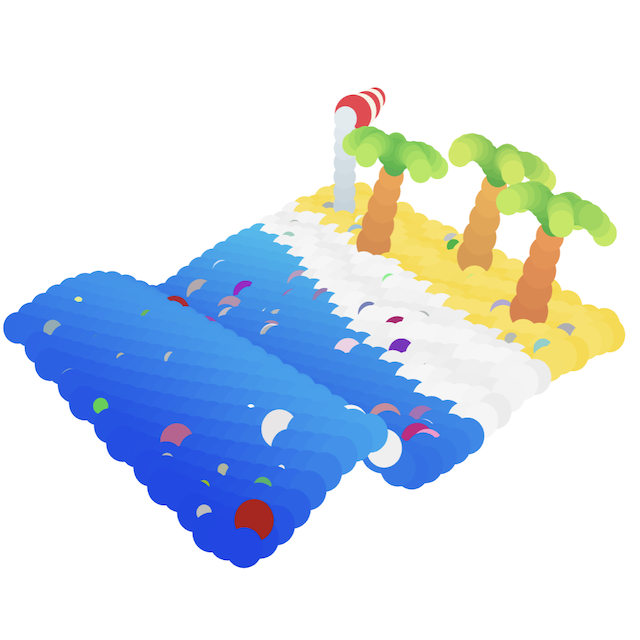
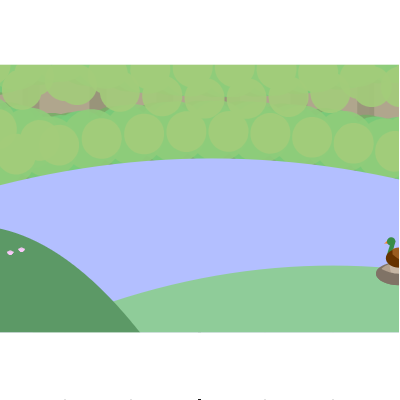
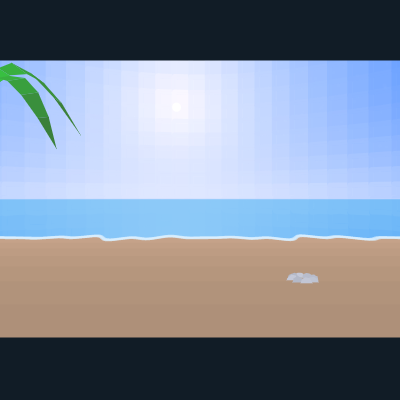
“Jannisses Beach 2.0” by Jannis Müller
Germany
From the judges:
At their core, every graph in the Cartesian plane is simply a collection of points. In this submission, we see those points cleverly positioned and animated to give the illusion of a thee-dimensional wave of water racing to meet the wind on a sun-filled shore. Like many great works of art, there is a message waiting to be experienced here—we encourage you to jump into this graph and play around with the controls. Can you find a beach you would be happy to immerse yourself in?
From the artist:
While experimenting with 3-dimensional points, I got inspired to make this tiny beach. For me the smooth running 3d animation was the most important factor, so I only have one list of displayed points. Changing the year shows how trash can ruin the idyllic beach.
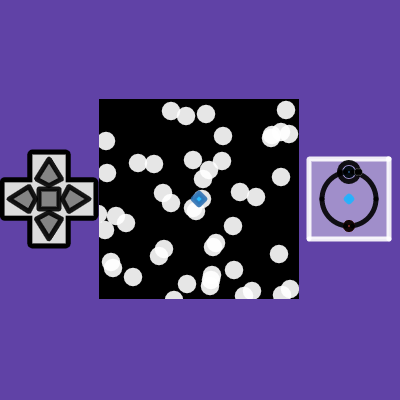
Trailblazer
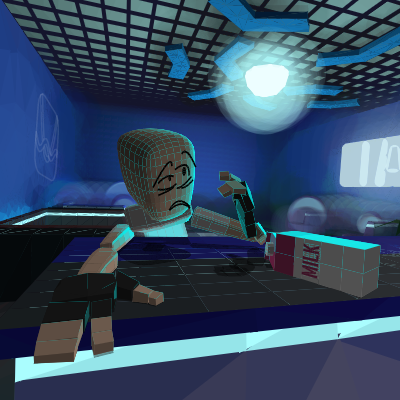
“Desmos Diner” by Ezra Oppenheimer
Canada
From the judges:
Part of the wonder of mathematics is that it provides a common language with which we can model the world. Desmos provides a particular dialect of that language, as do other tools like Python (a programming language) and Blender (a 3-D modeling software). For this submission, the artist leveraged the common mathematical foundation in each of these tools to once again push the boundaries of what we think is possible to create with Desmos. From lighting effects to character rigging to sorting polygons for occlusion, this graph is a wonderful integration of so many different techniques. Click through to the pre-recorded “Featured Animation” to see the character move about the scene.
From the artist:
I wanted to tell a story about a man who drank too much sinusoidal milk. For this graph, I learned about facial animations, motion outputs, vector graphics, UV textures, Desmos' API, Blender, Python, and much more! I also learned about the five megabyte graph limit. :)
Finalists 2021

“Four Function Calculator” by J. Lauren Soumilas
New Jersey, USA
“3D Light Grapher explicit function” by Moisés L. Caeiro
Spain
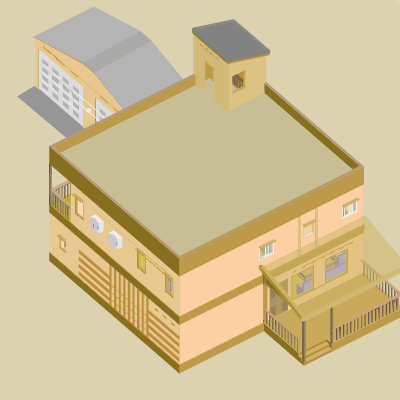
“House” by Muchamad Fath Bahrul Ulum
Indonesia
“눈물” by Sangyeop Kim
South Korea
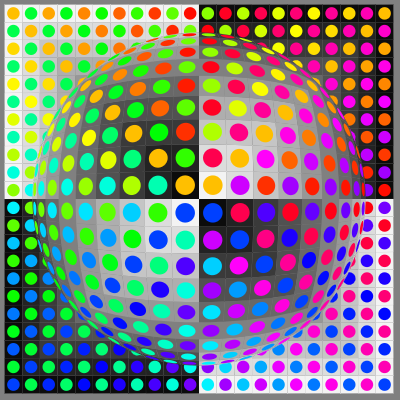
“Vasarely template” by dohduhdah
Netherlands
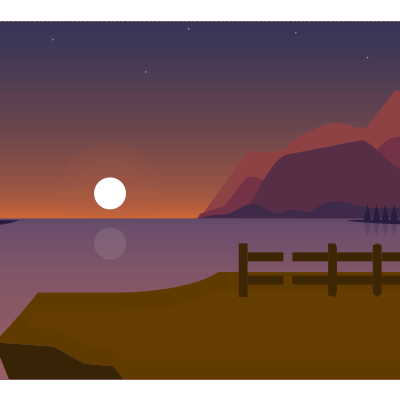
“Minimalist sunset” by Victor A. M. Nossal
Brazil
“3D parametric” by Mathlab_Jordan
United States
“The Maze” by Andrew Osborne
Colorado, USA
“Shoreline Dreaming” by David Flores
California, USA
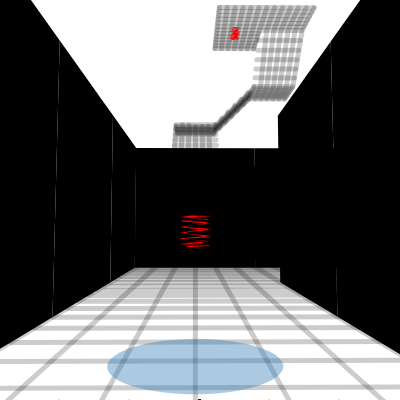
“Pinball” by Dylan Lee
New York, USA
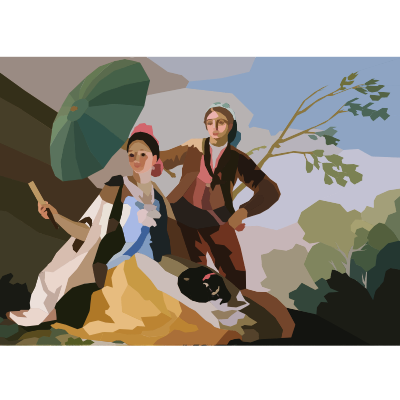
“Гойя Зонтик” by Kirill Barkov
Netherlands
“Bez Art” by Evan K
United States
“Desmos Plane 1.2” by Adrian
Oregon, USA

“Mountain by the Ocean” by Nishant Kumaran
Malaysia
“A junior high school” by Tang Benshin
Japan
“夏の関数アート” by TETH_Main
Japan